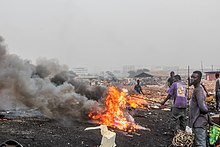
Waste management
Subclass of | sustainability and environmental management, energy and environmental engineering ![]() |
---|---|
Part of | European waste hierarchy ![]() |
Industry | waste management industry ![]() |
Significant environmental impact | health ![]() |
Practiced by | recyclable material collector, garbage collector, Q1191617, waste manager, waste management industry ![]() |
Relates to sustainable development goal, target or indicator | Target 12.4 of the Sustainable Development Goals ![]() |
Wikimedia import URL | https://en.wikipedia.org/wiki/Waste_management, https://en.wikipedia.org/wiki/Waste_management ![]() |
Waste management anaa waste disposal dey include de processes den actions dem require make dem manage waste from ein inception to ein final disposal.[1] Dis dey include de collection, transport, treatment, den disposal of waste, togeda plus monitoring den regulation of de waste management process den waste-related laws, technologies, den economic mechanisms.
Waste either fi be solid, liquid, anaa gases den each type get different methods of disposal den management. Waste management dey deal plus all types of waste, wey dey include industrial, chemical, municipal, organic, biomedical, den radioactive wastes. Insyd sam cases, waste fi pose a threat to human health.[2] Health issues be associated plus de entire process of waste management. Health issues sanso fi arise indirectly anaa directly: directly thru de handling of solid waste, den indirectly thru de consumption of water, soil, den chow.[2] Waste be produced by human activity, for example, de extraction den processing of raw materials.[3] Waste management be intended make e reduce de adverse effects of waste for human health top, de environment, planetary resources, den aesthetics.
De aim of waste management be make e reduce de dangerous effects of such waste for de environment den human health top. A big part of waste management dey deal plus municipal solid waste, wich be created by industrial, commercial, den household activity.[4]
Waste management practices no be de same across countries (developed den developing nations); regions (urban den rural areas), den residential den industrial sectors all fi take different approaches.[5]
Statistics den trends
[edit | edit source]Country | GDP (USD) | Population | Total waste dem generate (t) | Share of population wey dey live insyd urban areas | Waste dem generate per capita (kg/person) |
Aruba | 35,563 | 103,187 | 88,132 | 44% | 854 |
Afghanistan | 2,057 | 34,656,032 | 5,628,525 | 26% | 162 |
Angola | 8,037 | 25,096,150 | 4,213,644 | 67% | 168 |
Albania | 13,724 | 2,854,191 | 1,087,447 | 62% | 381 |
Andorra | 43,712 | 82,431 | 43,000 | 88% | 522 |
United Arab Emirates | 67,119 | 9,770,529 | 5,617,682 | 87% | 575 |
Argentina | 23,550 | 42,981,516 | 17,910,550 | 92% | 417 |
Armenia | 11,020 | 2,906,220 | 492,800 | 63% | 170 |
American Samoa | 11,113 | 55,599 | 18,989 | 87% | 342 |
Antigua and Barbuda | 17,966 | 96,777 | 30,585 | 24% | 316 |
Australia | 47,784 | 23,789,338 | 13,345,000 | 86% | 561 |
Austria | 56,030 | 8,877,067 | 5,219,716 | 59% | 588 |
Azerbaijan | 14,854 | 9,649,341 | 2,930,349 | 56% | 304 |
Burundi | 840 | 6,741,569 | 1,872,016 | 14% | 278 |
Belgium | 51,915 | 11,484,055 | 4,765,883 | 98% | 415 |
Benin | 2,227 | 5,521,763 | 685,936 | 48% | 124 |
Burkina Faso | 1,925 | 18,110,624 | 2,575,251 | 31% | 142 |
Bangladesh | 3,196 | 155,727,056 | 14,778,497 | 38% | 95 |
Bulgaria | 22,279 | 7,025,037 | 2,859,190 | 76% | 407 |
Bahrain | 47,938 | 1,425,171 | 951,943 | 90% | 668 |
Bahamas | 35,400 | 386,838 | 264,000 | 83% | 682 |
Bosnia and Herzegovina | 12,671 | 3,535,961 | 1,248,718 | 49% | 353 |
Belarus | 18,308 | 9,489,616 | 4,280,000 | 79% | 451 |
Belize | 7,259 | 359,288 | 101,379 | 46% | 282 |
Bermuda | 80,982 | 64,798 | 82,000 | 100% | 1,265 |
Bolivia | 7,984 | 10,724,705 | 2,219,052 | 70% | 207 |
Brazil | 14,596 | 208,494,896 | 79,069,584 | 87% | 379 |
Barbados | 15,445 | 280,601 | 174,815 | 31% | 623 |
Brunei | 60,866 | 423,196 | 216,253 | 78% | 511 |
Bhutan | 6,743 | 686,958 | 111,314 | 42% | 162 |
Botswana | 14,126 | 2,014,866 | 210,854 | 71% | 105 |
Central African Republic | 823 | 4,515,392 | 1,105,983 | 42% | 245 |
Canada | 47,672 | 35,544,564 | 25,103,034 | 82% | 706 |
Switzerland | 68,394 | 8,574,832 | 6,079,556 | 74% | 709 |
Channel Islands | 46,673 | 164,541 | 178,933 | 31% | 1,087 |
Chile | 20,362 | 16,829,442 | 6,517,000 | 88% | 387 |
China | 16,092 | 1,400,050,048 | 395,081,376 | 61% | 282 |
Ivory Coast | 3,661 | 20,401,332 | 4,440,814 | 52% | 218 |
Cameroon | 3,263 | 21,655,716 | 3,270,617 | 58% | 151 |
Democratic Republic of the Congo | 1,056 | 78,736,152 | 14,385,226 | 46% | 183 |
Republic of the Congo | 4,900 | 2,648,507 | 451,200 | 68% | 170 |
Colombia | 12,523 | 46,406,648 | 12,150,120 | 81% | 262 |
Comoros | 2,960 | 777,424 | 91,013 | 29% | 117 |
Cape Verde | 6,354 | 513,979 | 132,555 | 67% | 258 |
Costa Rica | 18,169 | 4,757,575 | 1,460,000 | 81% | 307 |
Cuba | 12,985 | 11,303,687 | 2,692,692 | 77% | 238 |
Curaçao | 27,504 | 153,822 | 24,704 | 89 | 161 |
Cayman Islands | 66,207 | 59,172 | 60,000 | 100% | 1,014 |
Cyprus | 39,545 | 1,198,575 | 769,485 | 67% | 642 |
Germany | 53,785 | 83,132,800 | 50,627,876 | 77% | 609 |
Djibouti | 6,597 | 746,221 | 114,997 | 78% | 154 |
Dominica | 11,709 | 72,400 | 13,176 | 71% | 182 |
Denmark | 57,821 | 5,818,553 | 4,910,859 | 88% | 844 |
Dominican Republic | 15,328 | 10,528,394 | 4,063,910 | 83% | 386 |
Algeria | 11,826 | 40,606,052 | 12,378,740 | 74% | 305 |
Ecuador | 11,896 | 16,144,368 | 5,297,211 | 64% | 328 |
Egypt | 10,301 | 87,813,256 | 21,000,000 | 43% | 239 |
Eritrea | 1,715 | 4,474,690 | 726,957 | 41% | 162 |
Spain | 40,986 | 47,076,780 | 22,408,548 | 81% | 476 |
Estonia | 36,956 | 1,326,590 | 489,512 | 69% | 369 |
Ethiopia | 1,779 | 99,873,032 | 6,532,787 | 22% | 65 |
Finland | 48,814 | 5,520,314 | 3,124,498 | 86% | 566 |
Fiji | 10,788 | 867,086 | 189,390 | 57% | 218 |
France | 46,110 | 67,059,888 | 36,748,820 | 81% | 548 |
Faroe Islands | 44,403 | 48,842 | 61,000 | 42% | 1,249 |
Federated States of Micronesia | 3,440 | 104,937 | 26,040 | 23% | 248 |
Gabon | 18,515 | 1,086,137 | 238,102 | 90% | 219 |
United Kingdom | 46,290 | 66,460,344 | 30,771,140 | 84% | 463 |
Georgia | 12,605 | 3,717,100 | 800,000 | 59% | 215 |
Ghana | 3,093 | 21,542,008 | 3,538,275 | 57% | 164 |
Gibraltar | 43,712 | 33,623 | 16,954 | 100% | 504 |
Guinea | 1,623 | 8,132,552 | 596,911 | 37% | 73 |
Gambia | 2,181 | 1,311,349 | 193,441 | 63% | 148 |
Guinea-Bissau | 1,800 | 1,770,526 | 289,514 | 44% | 164 |
Equatorial Guinea | 24,827 | 1,221,490 | 198,443 | 73% | 162 |
Greece | 30,465 | 10,716,322 | 5,615,353 | 80% | 524 |
Grenada | 13,208 | 105,481 | 29,536 | 37% | 280 |
Greenland | 43,949 | 56,905 | 50,000 | 87% | 879 |
Guatemala | 8,125 | 16,252,429 | 2,756,741 | 52% | 170 |
Guam | 59,075 | 159,973 | 141,500 | 95% | 885 |
Guyana | 9,812 | 746,556 | 179,252 | 27% | 240 |
Hong Kong | 57,216 | 7,305,700 | 5,679,816 | 100% | 777 |
Honduras | 5,396 | 9,112,867 | 2,162,028 | 58% | 237 |
Croatia | 28,829 | 4,067,500 | 1,810,038 | 58% | 445 |
Haiti | 2,953 | 10,847,334 | 2,309,852 | 57% | 213 |
Hungary | 32,643 | 9,769,949 | 3,780,970 | 72% | 387 |
Indonesia | 10,531 | 261,115,456 | 65,200,000 | 57% | 250 |
Isle of Man | 44,204 | 80,759 | 50,551 | 53% | 626 |
India | 6,497 | 1,352,617,344 | 189,750,000 | 35% | 140 |
Ireland | 83,389 | 4,867,316 | 2,910,655 | 64% | 598 |
Iran | 14,536 | 80,277,424 | 17,885,000 | 76% | 223 |
Iraq | 10,311 | 36,115,648 | 13,140,000 | 71% | 364 |
Iceland | 55,274 | 343,400 | 225,270 | 94% | 656 |
Israel | 37,688 | 8,380,100 | 5,400,000 | 93% | 644 |
Italy | 42,420 | 60,297,396 | 30,088,400 | 71% | 499 |
Jamaica | 9,551 | 2,881,355 | 1,051,695 | 56% | 365 |
Jordan | 10,413 | 8,413,464 | 2,529,997 | 91% | 301 |
Japan | 41,310 | 126,529,104 | 42,720,000 | 92% | 338 |
Kazakhstan | 22,703 | 16,791,424 | 4,659,740 | 58% | 278 |
Kenya | 3,330 | 41,350,152 | 5,595,099 | 28% | 135 |
Kyrgyzstan | 4,805 | 5,956,900 | 1,113,300 | 37% | 187 |
Cambodia | 3,364 | 15,270,790 | 1,089,000 | 24% | 71 |
Kiribati | 2,250 | 114,395 | 35,724 | 56% | 312 |
Saint Kitts and Nevis | 25,569 | 54,288 | 32,892 | 31% | 606 |
South Korea | 42,105 | 51,606,632 | 20,452,776 | 81% | 396 |
Kuwait | 58,810 | 2,998,083 | 1,750,000 | 100% | 584 |
Laos | 6,544 | 6,663,967 | 351,900 | 36% | 53 |
Lebanon | 16,967 | 5,603,279 | 2,040,000 | 89% | 364 |
Liberia | 1,333 | 3,512,932 | 564,467 | 52% | 161 |
Libya | 8,480 | 6,193,501 | 2,147,596 | 81% | 347 |
Saint Lucia | 14,030 | 177,206 | 77,616 | 19% | 438 |
Liechtenstein | 45,727 | 36,545 | 32,382 | 14% | 886 |
Sri Lanka | 12,287 | 21,203,000 | 2,631,650 | 19% | 124 |
Lesotho | 1,979 | 1,965,662 | 73,457 | 29% | 37 |
Lithuania | 37,278 | 2,786,844 | 1,315,390 | 68% | 472 |
Luxembourg | 114,323 | 619,896 | 490,338 | 91% | 791 |
Latvia | 30,982 | 1,912,789 | 839,714 | 68% | 439 |
Macau | 117,336 | 612,167 | 377,942 | 100% | 617 |
Morocco | 6,915 | 34,318,080 | 6,852,000 | 64% | 200 |
Monaco | 43,712 | 37,783 | 46,000 | 100% | 1,217 |
Moldova | 10,361 | 3,554,108 | 3,981,200 | 43% | 1,120 |
Madagascar | 1,566 | 24,894,552 | 3,768,759 | 39% | 151 |
Maldives | 17,285 | 409,163 | 211,506 | 41% | 517 |
Mexico | 19,332 | 125,890,952 | 53,100,000 | 81% | 422 |
Marshall Islands | 3,629 | 52,793 | 8,614 | 78% | 163 |
North Macedonia | 16,148 | 2,082,958 | 626,970 | 58% | 301 |
Mali | 2,008 | 16,006,670 | 1,937,354 | 44% | 121 |
Malta | 43,708 | 502,653 | 348,841 | 95% | 694 |
Myanmar | 1,094 | 46,095,464 | 4,677,307 | 31% | 101 |
Montenegro | 20,753 | 622,227 | 329,780 | 67% | 530 |
Mongolia | 10,940 | 3,027,398 | 2,900,000 | 69% | 958 |
Northern Mariana Islands | 60,956 | 54,036 | 32,761 | 92% | 606 |
Mozambique | 1,217 | 27,212,382 | 2,500,000 | 37% | 92 |
Mauritania | 4,784 | 3,506,288 | 454,000 | 55% | 129 |
Mauritius | 20,647 | 1,263,473 | 438,000 | 41% | 347 |
Malawi | 999 | 16,577,147 | 1,297,844 | 17% | 78 |
Malaysia | 23,906 | 30,228,016 | 12,982,685 | 77% | 429 |
Namibia | 6,153 | 1,559,983 | 256,729 | 52% | 165 |
New Caledonia | 57,330 | 278,000 | 108,157 | 72% | 389 |
Niger | 1,038 | 8,842,415 | 1,865,646 | 17% | 211 |
Nigeria | 4,690 | 154,402,176 | 27,614,830 | 52% | 179 |
Nicaragua | 4,612 | 5,737,723 | 1,528,816 | 59% | 266 |
Netherlands | 56,849 | 17,332,850 | 8,805,088 | 92% | 508 |
Norway | 64,962 | 5,347,896 | 4,149,967 | 83% | 776 |
Nepal | 2,902 | 28,982,772 | 1,768,977 | 21% | 61 |
Nauru | 11,167 | 13,049 | 6,192 | 100% | 475 |
New Zealand | 41,857 | 4,692,700 | 3,405,000 | 87% | 726 |
Oman | 30,536 | 3,960,925 | 1,734,885 | 86% | 438 |
Pakistan | 4,571 | 193,203,472 | 30,760,000 | 37% | 159 |
Panama | 28,436 | 3,969,249 | 1,472,262 | 68% | 371 |
Peru | 11,877 | 30,973,354 | 8,356,711 | 78% | 270 |
Philippines | 7,705 | 103,320,224 | 14,631,923 | 47% | 142 |
Palau | 18,275 | 21,503 | 9,427 | 81% | 438 |
Papua New Guinea | 3,912 | 7,755,785 | 1,000,000 | 13% | 129 |
Poland | 33,222 | 37,970,872 | 12,758,213 | 60% | 336 |
Puerto Rico | 34,311 | 3,473,181 | 4,170,953 | 94% | 1,201 |
Portugal | 34,962 | 10,269,417 | 5,268,211 | 66% | 513 |
Paraguay | 11,810 | 6,639,119 | 1,818,501 | 62% | 274 |
Palestine | 5,986 | 4,046,901 | 1,387,000 | 77% | 343 |
French Polynesia | 60,956 | 273,528 | 147,000 | 62% | 537 |
Qatar | 96,262 | 2,109,568 | 1,000,990 | 99% | 475 |
Romania | 29,984 | 19,356,544 | 5,419,833 | 54% | 280 |
Russia | 26,013 | 143,201,680 | 60,000,000 | 75% | 419 |
Rwanda | 1,951 | 11,917,508 | 4,384,969 | 17% | 368 |
Saudi Arabia | 48,921 | 31,557,144 | 16,125,701 | 84% | 511 |
Sudan | 4,192 | 38,647,804 | 2,831,291 | 35% | 73 |
Senegal | 3,068 | 15,411,614 | 2,454,059 | 48% | 159 |
Singapore | 97,341 | 5,703,600 | 1,870,000 | 100% | 328 |
Solomon Islands | 2,596 | 563,513 | 179,972 | 25% | 319 |
Sierra Leone | 1,238 | 5,439,695 | 610,222 | 43% | 112 |
El Salvador | 7,329 | 6,164,626 | 1,648,996 | 73% | 267 |
San Marino | 58,806 | 33,203 | 17,175 | 97% | 517 |
Somalia | 1,863 | 14,317,996 | 2,326,099 | 46% | 162 |
Serbia | 18,351 | 6,944,975 | 2,347,402 | 56% | 338 |
South Sudan | 1,796 | 11,177,490 | 2,680,681 | 20% | 240 |
São Tomé and Príncipe | 3,721 | 191,266 | 25,587 | 74% | 134 |
Suriname | 16,954 | 526,103 | 78,620 | 66% | 149 |
Slovakia | 31,966 | 5,454,073 | 2,296,165 | 54% | 421 |
Slovenia | 39,038 | 2,087,946 | 1,052,325 | 55% | 504 |
Sweden | 52,609 | 10,285,453 | 4,618,169 | 88% | 449 |
Eswatini | 8,321 | 1,343,098 | 218,199 | 24% | 162 |
Seychelles | 23,303 | 88,303 | 48,000 | 58% | 544 |
Syria | 8,587 | 20,824,892 | 4,500,000 | 55% | 216 |
Chad | 1,733 | 11,887,202 | 1,358,851 | 24% | 114 |
Togo | 1,404 | 7,228,915 | 1,109,030 | 43% | 153 |
Thailand | 16,302 | 68,657,600 | 26,853,366 | 51% | 391 |
Tajikistan | 2,616 | 8,177,809 | 1,787,400 | 28% | 219 |
Turkmenistan | 11,471 | 5,366,277 | 500,000 | 53% | 93 |
Timor-Leste | 3,345 | 1,268,671 | 63,875 | 31% | 50 |
Tonga | 5,636 | 104,951 | 17,238 | 23% | 164 |
Trinidad and Tobago | 28,911 | 1,328,100 | 727,874 | 53% | 548 |
Tunisia | 10,505 | 11,143,908 | 2,700,000 | 70% | 242 |
Turkey | 28,289 | 83,429,616 | 35,374,156 | 76% | 424 |
Tuvalu | 3,793 | 11,097 | 3,989 | 64% | 360 |
Tanzania | 2,129 | 49,082,996 | 9,276,995 | 35% | 189 |
Uganda | 1,972 | 35,093,648 | 7,045,050 | 25% | 201 |
Ukraine | 11,535 | 45,004,644 | 15,242,025 | 70% | 339 |
Uruguay | 20,588 | 3,431,552 | 1,260,140 | 96% | 367 |
United States | 61,498 | 326,687,488 | 265,224,528 | 83% | 812 |
Uzbekistan | 5,164 | 29,774,500 | 4,000,000 | 50% | 134 |
Saint Vincent and the Grenadines | 11,972 | 109,455 | 31,561 | 53% | 288 |
Venezuela | 14,270 | 29,893,080 | 9,779,093 | 88% | 327 |
British Virgin Islands | 24,216 | 20,645 | 21,099 | 49% | 1,022 |
United States Virgin Islands | 30,437 | 105,784 | 146,500 | 96% | 1,385 |
Vietnam | 5,089 | 86,932,496 | 9,570,300 | 37% | 110 |
Vanuatu | 3,062 | 270,402 | 70,225 | 26% | 260 |
Samoa | 6,211 | 187,665 | 27,399 | 18% | 146 |
Yemen | 8,270 | 27,584,212 | 4,836,820 | 38% | 175 |
South Africa | 12,667 | 51,729,344 | 18,457,232 | 67% | 357 |
Zambia | 3,201 | 14,264,756 | 2,608,268 | 45% | 183 |
Zimbabwe | 3,191 | 12,500,525 | 1,449,752 | 32% | 116 |
Scientific journals
[edit | edit source]Related scientific journals insyd dis area dey include:
- Environmental and Resource Economics
- Environmental Monitoring and Assessment
- Journal of Environmental Assessment Policy and Management
- Journal of Environmental Economics and Management
References
[edit | edit source]- ↑ "Environment Statistics". United Nations Statistics Division. Archived from the original on 17 March 2017. Retrieved 3 March 2017.
- ↑ 2.0 2.1 Giusti, L. (2009-08-01). "A review of waste management practices and their impact on human health". Waste Management (in English). 29 (8): 2227–2239. Bibcode:2009WaMan..29.2227G. doi:10.1016/j.wasman.2009.03.028. ISSN 0956-053X. PMID 19401266. Archived from the original on 25 November 2018. Retrieved 4 December 2020.
- ↑ "Waste". Environment Statistics. United Nations Statistics Division. Archived from the original on 1 December 2017. Retrieved 3 March 2017.
- ↑ "Wastes". U.S. Environmental Protection Agency (in English). 2017-11-02. Retrieved 2023-08-19.
- ↑ Davidson, Gary (June 2011). "Waste Management Practices: Literature Review" (PDF). Dalhousie University – Office of Sustainability. Archived from the original (PDF) on 1 February 2012. Retrieved 3 March 2017.
- ↑ "No time to waste: A sustainability challenge for cities". Atlas of Sustainable Development Goals 2023 (in English). Retrieved 2024-05-20.
Bibliography
[edit | edit source]- Letcher, Trevor M.; Vallero, Daniel A., eds. (2011). Waste: A Handbook for Management. Burlington: Academic Press. ISBN 978-0-12-381475-3.
External links
[edit | edit source]